
| Analysis Menu | |
The analysis menu provides access to complex dialogs that support data selection and analysis. Please use the appropriate links to read related information in detail.
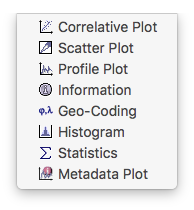
Opens the Correlative Plot dialog that displays a configurable correlative plot to display raster vs. correlative data (e.g. obtained from in-situ measurements) for distinct vertex points.
Opens the Scatter Plot dialog that displays a configurable scatter plot for two selected bands or tie-point grids.
Opens the Profile Plot dialog that displays a configurable profile plot which can be used to either display raster data along a transect line, or to compare raster data against correlative data along a vertex shape (e.g. representing a sequence of in-situ measurements).
Opens the Information dialog that shows the properties of the selected band or tie-point grid and the current product.
Opens the Geo-Coding Information dialog that displays the geo-coding information for the product currently selected.
Opens the Histogram dialog that displays a configurable histogram for the selected band or tie-point grid.
Opens the Statistics dialog that displays statistical information for the selected band or tie-point grid.
Opens the Metadata Plot dialog that allows the user to plot metadata values.