
| Statistics | |
This dialog, opened via ![]() , displays statistical information about the currently
selected band. See the screenshot for an example.
, displays statistical information about the currently
selected band. See the screenshot for an example.
The set of statistical information displayed comprises: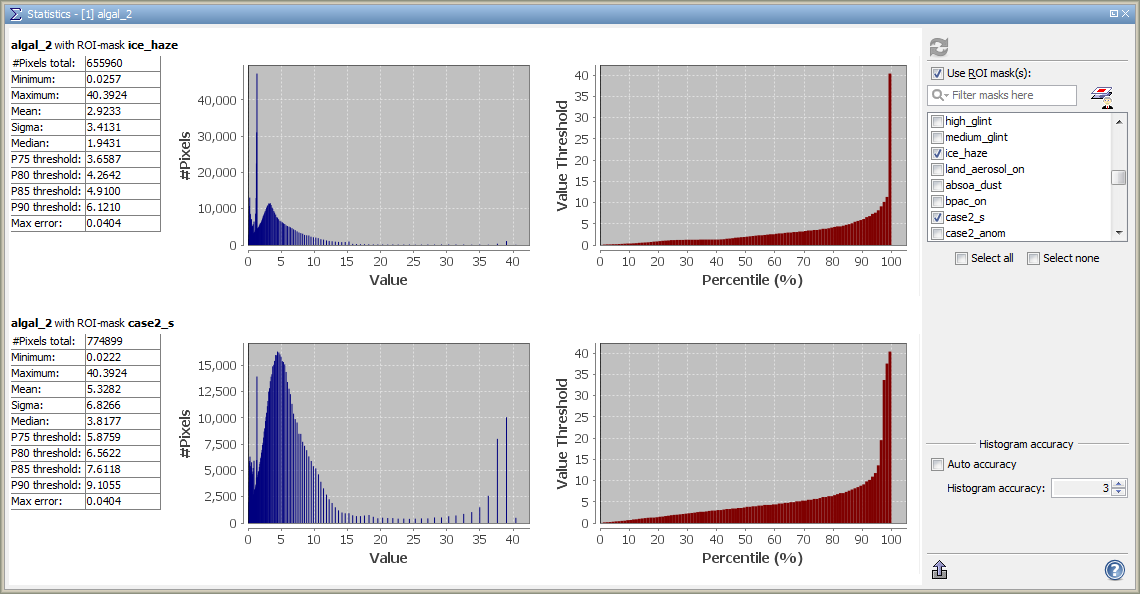
Additionally, two diagrams are displayed: the left one is a histogram, the right one shows the thresholds for all
percentiles.
The statistics can be computed for a whole band, or the considered pixels can be restricted to those matching a
single or multiple ROI masks. The list of masks can be narrowed down by typing a pattern into the text field. For
convenience, there is also the ![]() -icon which allows the user to open the
Mask Manager tool window.
-icon which allows the user to open the
Mask Manager tool window.
The section "Statistical accuracy" allows the user to specify the accuracy with which the histogram shall be computed. Higher numbers indicate a higher accuracy but may lead to a considerably longer computation time. More precisely, this parameter determines the number of bin cells used for computing the histogram: the number of bin cells is computed by 10^a with a the parameter. As the median and the percentile thresholds are derived from the histogram, the accuracy also influences these measures. The parameter value must be between 0 (histogram with one single bin) and 6 (histogram with 1,000,000 bins). When auto accuracy is enabled, the accuracy is set to 3.
The export button below allows to export the statistics as CSV file. In case the statistics have been computed for ROI mask(s) which come from a shapefile, they also can be export to this original shapefile, thus enrich that shapefile by the statistical information.
Note: A mouse right-click within the statistics tables brings up a context menu with the item Copy data to clipboard. This will copy the diagram data as tabulated text to the system clipboard. The copied text can then be pasted directly into a spreadsheet application (e.g. Microsoft® Excel).