Scatter Plot Display
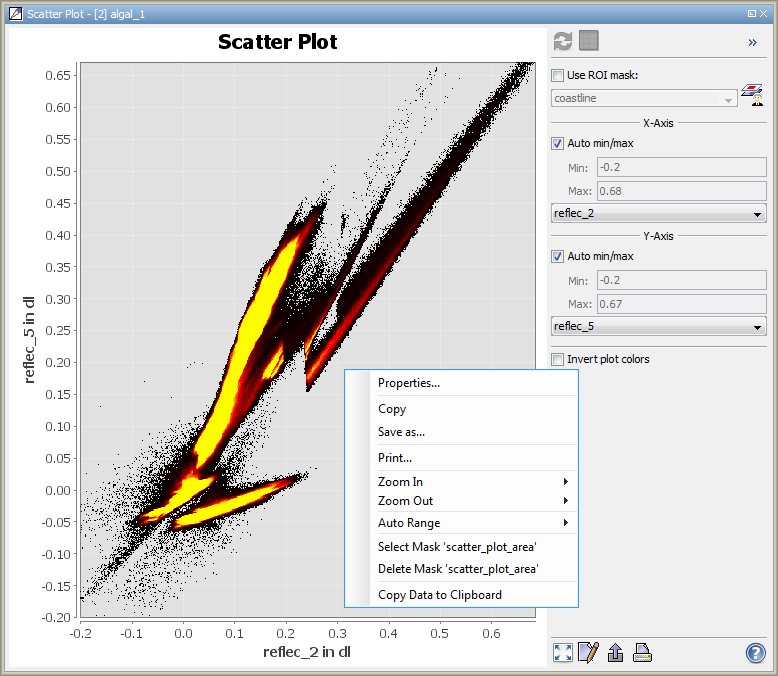
This dialog allows the user to plot one raster data node against another. See screenshot below for an example.
Mode of operation
For each band, the value range is evenly divided into 512 bins.
The scatter plot shows these bins plotted against each other, resulting in 512*512 cells.
For each cell, the number of pixels within the according bands' value ranges is counted and color coded.
Yellow stands for large amounts of pixels, black for small ones.
If no pixel is assigned to a distinct cell, the cell will receive no color.
The color coding can be inverted using the 'Invert plot colors' checkbox.
The scatter plot will be re-computed when clicking  .
.
Options Panel
The options panel on the right offers some configuration options. Note that the scatter plot needs to be re-computed
for changes to the option panel to take effect.
- Refresh View
Causes the scatter plot to be (re-)computed.
The button is only enabled when a computation is expected to lead to a different scatter plot than the one on
display.
- Collapse/Expand Options Panel
 /
/ 
Collapses or expands the options panel.
- ROI Mask
A ROI mask may be used to mask out values. All values which do not match the mask are not taken
into account. For convenience, the mask manager may be openened from the scatter plot window using the
 -button.
For creating a ROI mask from the scatter plot, see 'Select Mask 'scatter_plot_area'' from the context menu.
- Auto min/max
For both bands, the minimum and maximum values to be considered during the computation
of the scatter plot can be set explicitly.
This can be done by disabling the checkbox for the respective band and entering the desired min- or max-value.
When the checkboxes are enabled, min- and max-values will be determined automatically.
- Invert plot colors
Inverts the color range. When selected, large pixel frequencies will be displayed in black, small ones in
yellow.
- Zoom all

Adjusts both axes to the full data range.
The 'Auto range' entry in the context menu can also be used.
- Edit Properties

Allows editing several properties (colors, axes, etc.) of the diagram.
The 'Properties...' entry in the context menu can also be used.
- Save chart as image

Saves the diagram as image (PNG).
The 'Save as...' entry in the context menu can also be used.
- Print chart

Prints the diagram.
The 'Print...' entry in the context menu can also be used.
- Help

Displays this page.
Context Menu
A click with the right mouse button on the diagram opens a context menu
which consists of the following menu items:
- Properties...
Allows editing several properties (colors, axes, etc.) of the diagram.
The on the right 'Plot' panel can also be used.
- Copy
Copies the diagram as image into the clipboard.
- Save As...
Saves the diagram as image (PNG).
The on the right 'Plot' panel can also be used.
- Print...
Print the diagram.
The on the right 'Plot' panel can also be used.
- Zoom In
- Both Axes - Zoom in on both axes.
Zooming can also be achieved by drawing a rectangle by clicking at the top left corner of the desired
zooming area, dragging the mouse to the bottom right corner, and releasing. Note that this won't work when
'Select Mask 'histogram_plot_area'' is selected.
- Domain Axes - Zoom in only on the domain axis.
- Range Axes - Zoom in only on the range axis.
- Zoom Out
- Both Axes - Zoom out on both axes.
- Domain Axes - Zoom out only on the domain axis.
- Range Axes - Zoom out only on the range axis.
- Auto Range
- Both Axes - Adjusts both axes to the full data range.
The on the right 'Plot' panel can also be used.
- Domain Axes - Adjusts the domain axis to the full data range.
- Range Axes - Adjusts the range axis to the full data range.
- Select Mask 'scatter_plot_area'
Allows the user to create a mask from the scatter plot.
After selecting the menu entry, an elliptical selection frame can be created by clicking into the plot,
dragging, and releasing. The mask will be created according to the values selected, and will immediately be
selected.
- Delete Mask 'scatter_plot_area'
Removes the mask 'histogram_plot_area' (in case it has been created before).
- Copy Data to Clipboard
This will copy the diagram data as tabulated text to the system clipboard.
The copied text can then be pasted directly into a spreadsheet application
(e.g. Microsoft® Excel).