

|
|
|
|
This is a brief tutorial example walk through of running the SNAP/SeaDAS gpt command line tool. This tutorial will demonstrate the use of the BandMaths operator in gpt. Examples of many operators can be found in the GPT Cookbook. |
|
1 Running gpt within the GUI GraphBuilder 2 Accessing gpt from the command line 3 Running gpt on the command line 4 Passing the input and output files as command line arguments |
1 Running gpt within the GUI GraphBuilder
The gpt processing can be run from within the GUI by using the GraphBuilder Tool. Let's use the
BandMaths gpt operator to generate an output file which contains a single custom mathematically derived band.
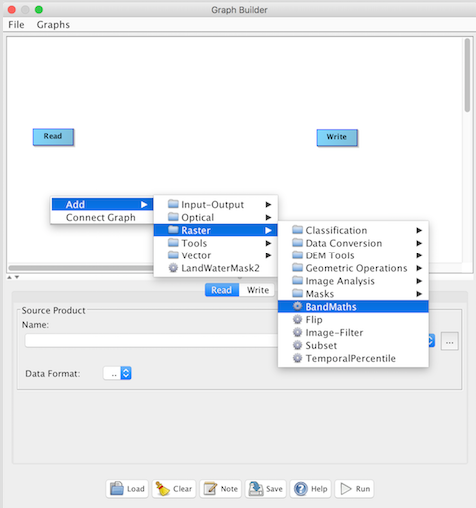
Open the GraphBuilder tool and you will notice that nodes for the "Read" and "Write" operators are automatically
loaded within the window by default.
Add in the BandMaths operator node by right-clicking inside the window and selecting "Add > Raster > BandMaths".
A square representing the BandMaths node should appear inside the window.
To establish a graph workflow you need to connect the nodes. To do this you can right-click in the GraphBuilder
window and select "Connect Graph". This will automatically connect all the nodes. Optionally you can draw each
node connection one at a time by hovering the mouse over the left edge of the receiving node and then dragging the
mouse to the desired source node. For more complicated graphs and graphs with parallel threads you will likely
need to draw the connections this way manually one at a time.
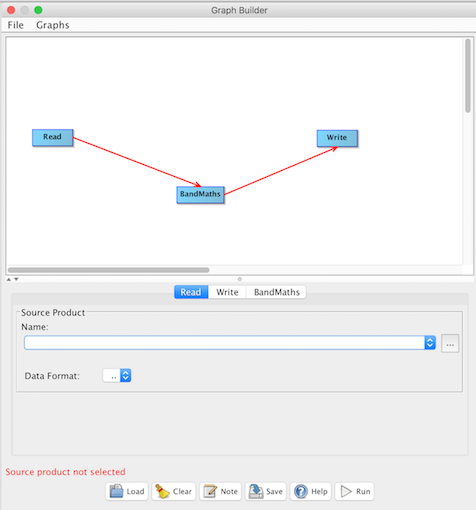
To configure the Read operator click on the "Read" tab and then choose an input file (aka
Source Product Name). For this example we will use the NASA ocean color file "A2010283180500.L2_LAC_OC.nc".
Then select the "Data Format" = "SeaDAS-L2".
To configure the Write operator click on the "Write" tab and then specify an output file (aka
Target Product Name and its Directory). For this example we will name it "A2010283180500.L2_LAC_OC.GptTutorialSection01.dim".
Then select the data format of the output file "Save as" = "BEAM-DIMAP".
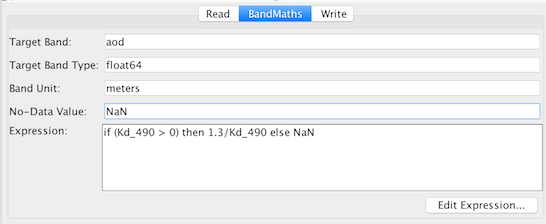
To configure the BandMaths operator node click on the "BandMaths" tab and then specify the following (see image):
Before running gpt let's save the graph file for use later in section 3. To save the graph file click the
"Save" button and then select a file name for the graph "GptTutorialGraphSection03.xml"
Now run gpt by clicking the "Run" button. The file A2010283180500.L2_LAC_OC.GptTutorialSection01.dim will then be written in
the directory which you specified as well as be loaded into the "Product Explorer (File Manager)"
window.
2 Accessing gpt from the command line
TBD: discuss configuring path/alias to be "gpt" (platform dependent)
3 Running gpt on the command line
Now let's run gpt from the command line. In section 1 we ran gpt from the GUI GraphBuilder tool as well as saved the graph file "GptTutorialGraphSection03.xml". Here is that graph file.
File = GptTutorialGraphSection03.xml
<graph id="Graph">
<version>1.0</version>
<node id="Read">
<operator>Read</operator>
<sources/>
<parameters class="com.bc.ceres.binding.dom.XppDomElement">
<file>/Users/seadas/GPT_Cookbook/GPT_Tutorial/A2010283180500.L2_LAC_OC.nc</file>
<formatName>SeaDAS-L2</formatName>
</parameters>
</node>
<node id="BandMaths">
<operator>BandMaths</operator>
<sources>
<sourceProduct refid="Read"/>
</sources>
<parameters class="com.bc.ceres.binding.dom.XppDomElement">
<targetBands>
<targetBand>
<name>aod</name>
<type>float64</type>
<expression>if (Kd_490 > 0) then 1.3/Kd_490 else NaN</expression>
<description/>
<unit>meters</unit>
<noDataValue>NaN</noDataValue>
</targetBand>
</targetBands>
<variables/>
</parameters>
</node>
<node id="Write">
<operator>Write</operator>
<sources>
<sourceProduct refid="BandMaths"/>
</sources>
<parameters class="com.bc.ceres.binding.dom.XppDomElement">
<file>/Users/seadas/GPT_Cookbook/GPT_Tutorial/A2010283180500.L2_LAC_OC.GptTutorialSection03.dim</file>
<formatName>BEAM-DIMAP</formatName>
</parameters>
</node>
<applicationData id="Presentation">
<Description/>
<node id="Read">
<displayPosition x="37.0" y="134.0"/>
</node>
<node id="BandMaths">
<displayPosition x="230.0" y="226.0"/>
</node>
<node id="Write">
<displayPosition x="455.0" y="135.0"/>
</node>
</applicationData>
</graph>
|
You will notice that the input and output files are explicitly defined in the graph file:
Input file: /Users/seadas/GPT_Cookbook/GPT_Tutorial/A2010283180500.L2_LAC_OC.nc
Output file: /Users/seadas/GPT_Cookbook/GPT_Tutorial/A2010283180500.L2_LAC_OC.GptTutorialSection03.dim
This is fine for now, we will address this in the next section.
Note: these absolute file paths will likely differ
from the graph file which you created in the previous example, so either use your graph
file or edit this one to reflect your absolute input/output file paths.
Also note: the placement locations of the nodes in "applicationData" will also likely differ in your file.)
To run this graph file from the command line execute the following command:
gpt GptTutorialGraphSection03.xml |
4 Passing the input and output files as command line arguments
We will continue the rest of this tutorial by running exclusively from the command line. The
previous example was a bit limited in that it cannot be reused for other input files. So
let's pull the explicitly defined input file and output file
out of the graph file and have it passed in as a command line argument. To do this we change 2 lines:
The line in the Read node:
<file>/Users/seadas/GPT_Cookbook/GPT_Tutorial/A2010283180500.L2_LAC_OC.nc</file>
will become:
<file>${ifile}</file>
The line in the Write node:
<file>/Users/seadas/GPT_Cookbook/GPT_Tutorial/A2010283180500.L2_LAC_OC.GptTutorialSection03.dim</file>
will become:
<file>${ofile}</file>
By doing this ${ifile} and ${ofile} will become parameters to be passed in at the command line. Note that the
GraphBuilder tool does not support these command line parameters so the GUI specific section "applicationData"
of the graph file is no longer needed and can be removed.
The resulting file should look like this:
File = GptTutorialGraphSection04.xml
<graph id="GptTutorialGraphSection04">
<version>1.0</version>
<node id="Read">
<operator>Read</operator>
<sources/>
<parameters class="com.bc.ceres.binding.dom.XppDomElement">
<file>${ifile}</file>
<formatName>SeaDAS-L2</formatName>
</parameters>
</node>
<node id="BandMaths">
<operator>BandMaths</operator>
<sources>
<sourceProduct refid="Read"/>
</sources>
<parameters class="com.bc.ceres.binding.dom.XppDomElement">
<targetBands>
<targetBand>
<name>aod</name>
<type>float64</type>
<expression>if (Kd_490 > 0) then 1.3/Kd_490 else NaN</expression>
<description/>
<unit>meters</unit>
<noDataValue>NaN</noDataValue>
</targetBand>
</targetBands>
<variables/>
</parameters>
</node>
<node id="Write">
<operator>Write</operator>
<sources>
<sourceProduct refid="BandMaths"/>
</sources>
<parameters class="com.bc.ceres.binding.dom.XppDomElement">
<file>${ofile}</file>
<formatName>BEAM-DIMAP</formatName>
</parameters>
</node>
</graph>
|
This time when you run gpt from the command line you will pass in the input and output files as
parameters. To do this you use the convention -P{parameter_name}={parameter_value}. So you
will have the following 2 command line arguments:
-Pifile=A2010283180500.L2_LAC_OC.nc
-Pofile=A2010283180500.L2_LAC_OC.GptTutorialSection04.dim
Your gpt command line will look like this:
Command Line Entry
gpt GptTutorialGraphSection04.xml -Pifile=A2010283180500.L2_LAC_OC.nc -Pofile=A2010283180500.L2_LAC_OC.GptTutorialSection04.dim |
5 Adding in some parameters not available in the GUI
This isn't always the case, but there may be parameters available at the command line which are
not available (at least not yet) via the GUI. This section goes over how to find these parameters
and add them to your graph file.
If you have a familiarity with all the parameters normally in a SNAP/SeaDAS band you might notice
that some are missing in the graph file and in the BandMaths GUI. Take a look at the source file:
A2010283180500.L2_LAC_OC.nc. Right click on the band Kd_490 and select "Properties" and you will
notice that some useful parameters were not available in the GUI (these parameters should ideally be
added in a future release). It would be useful to have the "Valid-Pixel Expression" and perhaps
the "Description"
be available to you. The complete listing of parameters available for the BandMaths gpt operator
can be found by typing on the command line "gpt -h BandMaths".
Let's modify the graph file to add in the following parameter lines:
<description>apparent optical depth</description>
<validExpression>aod > (1.3/6.0) and aod < (1.3/0.01)</validExpression>
<spectralWavelength>490.0</spectralWavelength>
So your graph file will now look like this:
File = GptTutorialGraphSection05.xml
<graph id="GptTutorialGraphSection05">
<version>1.0</version>
<node id="Read">
<operator>Read</operator>
<sources/>
<parameters class="com.bc.ceres.binding.dom.XppDomElement">
<file>${ifile}</file>
<formatName>SeaDAS-L2</formatName>
</parameters>
</node>
<node id="BandMaths">
<operator>BandMaths</operator>
<sources>
<sourceProduct refid="Read"/>
</sources>
<parameters class="com.bc.ceres.binding.dom.XppDomElement">
<targetBands>
<targetBand>
<name>aod</name>
<type>float64</type>
<expression>if (Kd_490 > 0) then 1.3/Kd_490 else NaN</expression>
<description>apparent optical depth</description>
<unit>meters</unit>
<validExpression>aod > (1.3/6.0) and aod < (1.3/0.01)</validExpression>
<noDataValue>NaN</noDataValue>
<spectralWavelength>490.0</spectralWavelength>
</targetBand>
</targetBands>
<variables/>
</parameters>
</node>
<node id="Write">
<operator>Write</operator>
<sources>
<sourceProduct refid="BandMaths"/>
</sources>
<parameters class="com.bc.ceres.binding.dom.XppDomElement">
<file>${ofile}</file>
<formatName>BEAM-DIMAP</formatName>
</parameters>
</node>
</graph>
|
Then run this on the command line as:
Command Line Entry
gpt GptTutorialGraphSection05.xml -Pifile=A2010283180500.L2_LAC_OC.nc -Pofile=A2010283180500.L2_LAC_OC.GptTutorialSection05.dim |
6 Using a parameter file
Another way to make your graph file more robust and reusable is to define parameters within
a separate parameter file which contains a name=value pair list.
To do this modify the following lines of GptTutorialGraphSection05.xml:
<name>aod</name>
<type>float64</type>
<expression>if (Kd_490 > 0) then 1.3/Kd_490 else NaN</expression>
<description>apparent optical depth</description>
<unit>meters</unit>
<validExpression>aod > (1.3/6.0) and aod < (1.3/0.01)</validExpression>
<noDataValue>NaN</noDataValue>
<spectralWavelength>490.0</spectralWavelength>
    <name>${band1Name}</name>
    <type>${band1Type}</type>
    <expression>${band1Expression}</expression>
    <description>${band1Description}</description>
    <unit>${band1Unit}</unit>
    <validExpression>${band1ValidExpression}</validExpression>
    <noDataValue>${band1NoDataValue}</noDataValue>
    <spectralWavelength>${band1SpectralWavelength}</spectralWavelength>
So your graph file will now look like this:
File = GptTutorialGraphSection06.xml
<graph id="GptTutorialGraphSection06">
    <version>1.0</version>
    <node id="Read">
        <operator>Read</operator>
        <sources/>
        <parameters class="com.bc.ceres.binding.dom.XppDomElement">
            <file>${ifile}</file>
            <formatName>SeaDAS-L2</formatName>
        </parameters>
    </node>
    <node id="BandMaths">
        <operator>BandMaths</operator>
        <sources>
            <sourceProduct refid="Read"/>
        </sources>
        <parameters class="com.bc.ceres.binding.dom.XppDomElement">
            <targetBands>
                <targetBand>
                    <name>${band1Name}</name>
                    <type>${band1Type}</type>
                    <expression>${band1Expression}</expression>
                    <description>${band1Description}</description>
                    <unit>${band1Unit}</unit>
                    <validExpression>${band1ValidExpression}</validExpression>
                    <noDataValue>${band1NoDataValue}</noDataValue>
                    <spectralWavelength>${band1SpectralWavelength}</spectralWavelength>
                </targetBand>
            </targetBands>
            <variables/>
        </parameters>
    </node>
    <node id="Write">
        <operator>Write</operator>
        <sources>
            <sourceProduct refid="BandMaths"/>
        </sources>
        <parameters class="com.bc.ceres.binding.dom.XppDomElement">
            <file>${ofile}</file>
            <formatName>BEAM-DIMAP</formatName>
        </parameters>
    </node>
</graph>
|
File = GptTutorialSection06.par
band1Name=aod band1Type=float64 band1Expression=if (Kd_490 > 0) then 1.3/Kd_490 else NaN band1Description=apparent optical depth band1Unit=meters band1ValidExpression=aod > (1.3/6.0) and aod < (1.3/0.01) band1NoDataValue=NaN band1SpectralWavelength=490.0 |
Then run this on the command line as:
Command Line Entry
gpt GptTutorialGraphSection06.xml -p GptTutorialSection06.par -Pifile=A2010283180500.L2_LAC_OC.nc -Pofile=A2010283180500.L2_LAC_OC.GptTutorialSection06.dim |
Note: any of the parameters can be sent in via either the command line or the parameter file.