
|
|
|
|
Overview |
Overview
The Statistics tool enables you to process and view statistics and relevent metadata for any file loaded within SeaDAS. The statistics result can be refined to a particular region of interest and masking criteria. The statistics may be done for a single band or simultaneously for any and/or all bands within a file. A spreadsheet captures these statistics for easy viewing and export to other spreadsheet program. A histogram and percentile plot can also be simultaneously generated. This tool is available both from the GUI and from the command line.
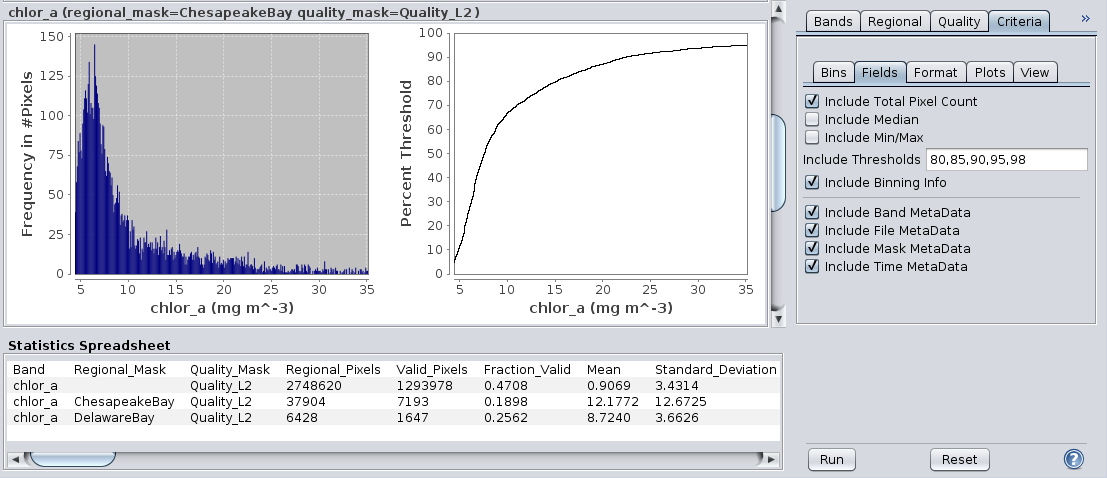
The following image illustrates the results of applying this tool to a level-2 file with a masking criteria applied for various regional water bodies.
Concepts
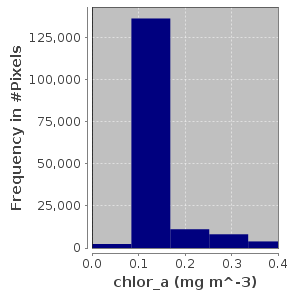
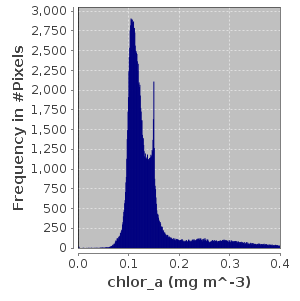
The histogram and percentile plots are created from the binned statistics and hence are dependent on the bin width, which derives from the number of bins and the bin span. The above image illustrates an example of an issue you may encounter if you do not have a reasonable bin resolution. This example uses the chlor_a product of a level-2 file, for the full scene. The image on the left has a bin count of 1,000 and the image on the right has a bin count of 100,000. Both span the default value range of statistics min and statistics max. The plot x-axis span has been reduced to span from 0.0 to 0.4. Keep in mind that the high end of chlor_a can be up to 100.0, which is the high end of its valid pixel expression. Since, for this example, the majority of the data occurs in only a small portion of the binning span data range, a total bin count of 1,000, as shown in the left image, does a poor job of identifying the histogram and data structure.
SeaDAS enables the masking out of unwanted pixels, so that the statistics can be done on only the pixels which meet the masking criteria. Conceptually, there are 2 types of masking: regional and quality. The first type is region based where you have defined a specific area of interest on the Earth, and pixels outside of this are intended to be masked out. Region masking, by it's very nature is stable across time and not effected by temporal changes such as atmospheric parameters, sunglint, straylight, etc. These latter parameters can be considered quality parameters.
Note: The primary advantage in splitting out the regional masking from the quality masking is that is enables calculate of total pixels in a region, and subsequent calculation of fraction of valid pixels.
For GPT:
Again there are 2 methods by which SeaDAS applies the masks
but with is a slight nuanced difference when running from the command line. In this case, relevant to the description above,
you can supply as parameters a shapefile and a validPixelExpression. The shapefile automatically loads into SeaDAS, and creates
the region of interest mask. If you want to added in validation masking you will need to do this with the validPixelExpression.
Note: when editing the validPixelExpression to include any custom validation parameters, keep in mind that you are overwriting the default validPixelExpression (for example for chlor_a you will want to do something like this: chlor_a > 0.001 && chlor_a <= 100 && !STRAYLIGHT && !HIGLINT).
In general, it may be best to consider mapping a file one way for statistics and another way for displaying data. For statistics you are best served using an equal area map projection (such as Albers Conic Equal Area, Lambert Azimuthal Equal Area, Sinusoidal, ...). With an equal area projection, the Earth surface area is the same for each resultant pixel and can be treated as such with an equal per pixel weighting. However, for large scenes, an equal area map projection may not look natural so using a conformal projection (such as Mercator and Stereographic) is more ideal when displaying this type of imagery.
Note: selection of the "best" map projection is dependent on scene size (is it global, regional, local), scene shape (does it run narrow north-south, narrow west-east, or is it more square in shape), and scene location (is it at the equator, at one of the Poles, or some span of latitudes somewhere between the Pole and equator.
When choosing to not reproject and to do statistics directly on a level-2 file, you should take into consideration the fact that for most missions not all pixels in the level-2 file will have an equal Earth surface area. Pixels with a high sensor zenith angle can be substantially of greater surface area than those at a low sensor zenith angle. If you constrain your analysis to a region (grid box) size which limits this mix of large and small surface area pixels, statistics done directly on level-2 files can be more meaningful.
The table above illustrates for MODIS (the 1km bands) the percent difference of surface area between the smallest and largest pixels of several grid box sizes. The significant impact of sensor zenith angle on this is readily apparent. This table can be helpful in determining whether a particular grid box size is appropriate for your particular scene.
The following math band equation was used to determine pixel surface area for MODIS Aqua: 1.0*pow(((6371*sin((senz*PI/180)- (asin((6371/(6371+700))*sin(senz*PI/180))))/sin(asin((6371/(6371+700))*sin(senz*PI/180))))/700),2.0)/cos(senz*PI/180)
Statistics done on a virtual file can be extremely slow. And if done on a chain of virtual files can bog down to the point where the computer memory or some other issue just won't let the operation proceed. Try to avoid where possible these chains of virtual files and bands. If the file on which you are about to do statistics is a virtual file, you should consider first saving it (which transforms it into a real file), and then generating your statistics.
Metadata fields can be included with the statistics output. These fields are invaluable in documenting your statistics, especially if you run statistics and export the results individually for many files, and then gather it all together into a spreadsheet package or other package. Unlike statistics, which are precise numbers generated by exact algorithms based on data, metadata is quite dependent and reliant on the type and source of the file. SeaDAS makes its best effort at gathering together the metadata of a file to include with the statistics. This help document defines how each metadata field is searched for within a file.
Fields
This is a description of each of the fields generated by the Statistics tool.
_______________File#
The reference index number of the loaded file within the File Manager
Note: statistics can only be generated on a single file, and are performed on the currently selected view
Band
The raster band on which statistics are generated.
Note: the default is the band currently selected in the File Manager, but any band or multiple bands may be selected.
Regional_Mask
A mask applied to the data to restrict the pixels being which are processed. In addition, it is used to generate the field "Regional_Pixels".
Note: this is intended to be a mask of a region, or perhaps bathymetry depth (basically a mask which shouldn't vary over time)
Quality_Mask
A mask applied to the data to restrict the pixels being which are processed.
Note: this is intended to be a mask of data quality. This mask is applied to the valid pixel expression. It has no effect on the field "Regional_Pixels".
Regional_Pixels
The total number of pixels which match the regional_mask: null (NaN) pixels are included in this total.
Valid_Pixels
The total number of pixels which are valid. Valid means they match both the regional_mask and quality_mask: null (NaN) pixels are NOT included in this total.
Fraction_Valid
Fraction of the regional pixels which are valid: (Fraction_Valid = Valid_Pixels / Regional_Pixels)
These are the primary "calculated" statistics results fields.
Pixels
This is the total number of pixels used to calculate the statistics.
Note: this does include pixels which do not contain data.
Valid_Pixels
This is the total number of "valid" pixels used to calculate the statistics.
Note: this does not include pixels which do not contain data.
Fraction_Valid
This is the total number of valid pixels ("Valid_Pixels) divided by the total pixels ("Pixels").
Minimum
This is the minimum value of the "valid" pixels.
Maximum
This is the maximum value of the "valid" pixels.
Mean
This is the mean value of the "valid" pixels.
Median
This median value of the "valid" pixels. Calculated by converted 2d raster of "valid" pixels into an array and then obtaining the center element of the array.
Note: versions of SeaDAS prior to 7.5 calculated the median by binned the data and then obtaining the 50 percentile value. This method is a quicker calculation especially in the case of a large data set, but is dependent on the bin size. This field is still available as the'Median(Binned)' field.
Note: because, especially for larger files, the processing time can increase, this field is optional and you can set whether or not to have the median generated. >
Standard_Deviation
This is the standard deviation of the "valid" pixels.
Coefficient_of_Variation
Calculated as Standard_Deviation / Mean
Variance
This is the variance of the "valid" pixels.
Percent Thresholds
Calculated based on a histogram defined by binning the data. This is dependent on the number of bins.
This is information about the band. It is obtained directly from the loaded band. If you wish to edit this band information within the SeaDAS GUI, right-click on a band in the FileManager, then select Properties, then edit the fields. Now when you run statistics, your edited value will appear in the results.
Band
The band name.
Unit
The geophysical unit of the value represented in the band.
Band_Valid_Expression
Short for "Valid Pixel Expression" of the band. This is a logical mathematical expression of validation criteria specific to the band which is applied per pixel to determine whether the band pixel is valid.
Band_Description
A description of the band.
This is information about the file.
File
The name of the file "as loaded" into SeaDAS. The file name can be changed within SeaDAS, yet the original file still exists on your machine. If you change the file name within SeaDAS (File Manager: right-click file, then Properties, then edit Name), this new file name will be the name displayed by this field.
File_Format
This is the format of the file "as loaded" into SeaDAS. SeaDAS contains internal readers for many satellites and data levels. If you open the file in the GUI the default way (File > Open), then SeaDAS will determine which reader to use on the file. For example a standard OB.DAAC level-2 file when loaded in will use a level-2 file reader resulting in field "File_Format=SeaDAS-L2". If you instead import the file using File > Import > NetCDF-CF, the NetCDF-CF reader will be invoked and the resulting field will be "File_Format=NetCDF-CF.
File_Type
This is the file type determined "as loaded" into SeaDAS. It is dependent on the reader used internally within SeaDAS to load the file. It follows the same logic used in obtaining the "File_Format" mentioned above and is somewhat similar in meaning to that field.
File_Width
The width of the file raster.
File_Height
The height of the file raster.
Sensor
The name of the sensor which acquired the data. This field is obtained from the Global attributes of the metadata. The following attribute names are searched: "sensor_name", "instrument", "sensor". If one of these attributes is present then that value gets assigned to the statistics field "Sensor". Upper-case and camel-case variants of these fields are searched as well.
Platform
The name of the platform (satellite) on which the sensor is mounted which acquired the data. This field is obtained from the Global attributes of the metadata. The following attribute name is looked for: "platform". If one of these attributes is present then that value gets assigned to the statistics field "Platform". Upper-case and camel-case variants of these fields are searched as well.
Resolution
The ground surface resolution (at nadir) of the data. This field is obtained from the Global attributes of the metadata. The following attribute names are searched: "spatial_resolution", "resolution". If one of these attributes is present then that value gets assigned to the statistics field "Resolution". Upper-case and camel-case variants of these fields are searched as well.
Day_Night
Indicates whether the data was imaged during daylight or at night. This field is obtained from the Global attributes of the metadata. The following attribute names are searched: "day_night_flag", "day_night". If one of these attributes is present then that value gets assigned to the statistics field "Day_Night". Upper-case and camel-case variants of these fields are searched as well.
Orbit
The orbit revolution count of the satellite. The following attribute names are searched: "orbit_number", "orbit". If one of these attributes is present then that value gets assigned to the statistics field "Orbit". Upper-case and camel-case variants of these fields are searched as well. Files may span multiple orbits so this is searched as well. The following attribute names are searched: "start_orbit_number", "end_orbit", "end_orbit_number", "end_orbit". If anything is found within this orbit number span search then the start and end orbit number are assigned to the statistics field "Orbit".
Processing_Version
The processing version of the software which created the file. This field is obtained from the Global attributes of the metadata. The following attribute names are searched: "processing_version". If one of these attributes is present then that value gets assigned to the statistics field "Processing_Version". Upper-case and camel-case variants of these fields are searched as well.
Projection
The map projection of the file. If the file currently has a coordinate reference system defined for it within SeaDAS, then this is displayed along with the words "(obtained from CrsGeoCoding)". If not, then an attempt is made to obtain this from the Global attributes of the metadata. The following attribute names are searched: "map_projection","projection", "crs". If one of these attributes is present then that value gets assigned to the statistics field "Projection" along with the words "(obtained from MetaData)". Upper-case and camel-case variants of these fields are searched as well. Lastly, if no projection has been found then a java class is displayed. OB.DAAC level-2 files will indicate the class "BowtiePixelGeoCoding".
This is information about the regional mask. It is obtained directly from the loaded mask.
Mask
The mask name.
Mask_Description
A description of the band.
Mask_Expression
This is a logical mathematical expression of criteria specific to the mask which is applied per pixel to determine whether the mask is on or off.
This is information about the quality mask. It is obtained directly from the loaded mask.
Mask
The mask name.
Mask_Description
A description of the band.
Mask_Expression
This is a logical mathematical expression of criteria specific to the mask which is applied per pixel to determine whether the mask is on or off.
This is information about the file. It is obtained directly from the loaded file. If you wish to edit this time information within the SeaDAS GUI, right-click on the file in the FileManager, then select Properties, then edit the time fields. Now when you run statistics, your edited value will appear in the results.
Note: if the file end time is earlier than the file start time, then the statistics tools will switch these two time fields to be in correct time order.
Start_Date
The date portion of the file start time.
Start_Time
The time of day portion of the file start time.
End_Date
The date portion of the file end time.
End_Time
The time of day portion of the file end time.
This is information about the band. This is intended to be used on files created by the SeaDAS TimeSeries tool. The TimeSeries tool generates a single projected and collocated file from multiple input files each of a specific time. Each band in the output file came from a source file and the band is named based on the time of the input file. So the statistics tool obtained the time series metadata directly from the name of the band. If you wish to edit this time information within the SeaDAS GUI, right-click on the band in the FileManager, then select Properties, then edit the band name. Now when you run statistics, your edited value will appear in the results.
Date
The date portion of the band time.
Time
The time of day portion of the band time.
Plots
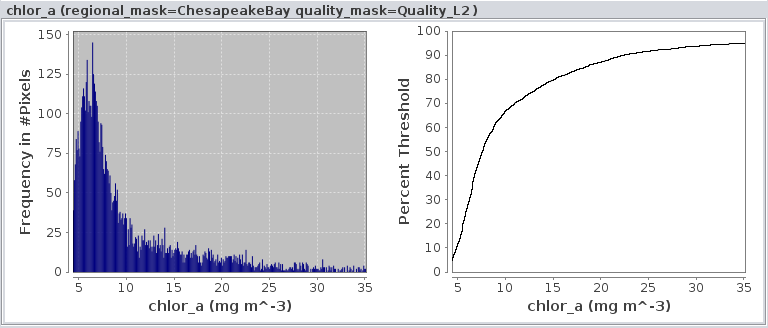
In addition to the numerical statistics and associated metadata, the Statistics tools can produce two plots: a histogram plot and a percentile plot. You can choose whether to generate them in the "View" parameter tab. You can choose a general format to be applied to all the plots in the "Plots" parameter tab. For convenience and readability the x-axis of both plots is by default formatted identically.
Note: Versions of SeaDAS prior to 7.5 had the percentile plot inverted with percentile being on the x-axis.
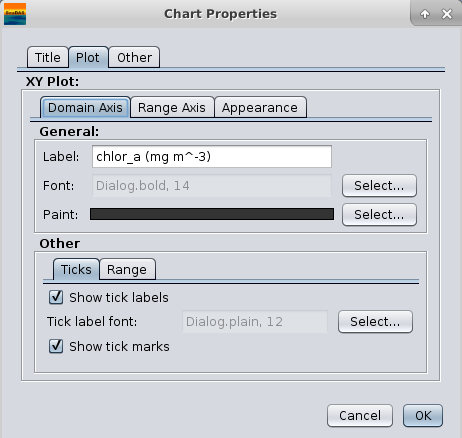
Once you have created the plots, you can more extensively format them. You can edit the range for either axis, edit the axis labels, add a title, alter the colors, and more. To do this, simply right click on the image of the plot and select "Properties". The above editor window will appear. You edit these plots one at a time, so consider using the "Plots" parameter tab for setting this before run.
Parameters
The following are the set of GUI windows and sub windows of the Statistics tool, in which you define the parameters to be used by the Statistics tool and then to run it to get the results.

This button is at the bottom right of the Statistics GUI. You can use this button at anytime to reset the parameters to the defaults.
Note: if you make a change to the preferences during the current session and you want this change to be applied, you can click this reset button. Otherwise changes in preferences will not show up in this GUI until the next time you launch SeaDAS.
Note: clicking this button will cause all parameters within the tab windows to be reset. The file selector and mask selector will not be reset when you click this button.

This button is located at the top right of the Statistics GUI. This button is very useful in that once you have generated your statistics, you can click this button and hide the right side of the GUI. This gives more real estate for the display of your results. Once hidden, the button converts to a show button in order for you to show this part of the GUI again.
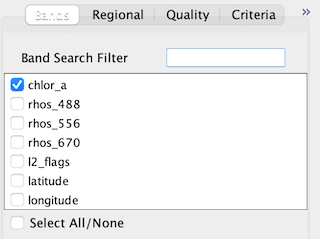
This is accessible from within the Statistics window. As of SeaDAS 7.5 you can now select multiple bands from within the same file on which to simultaneously generate the same statistics fields. For each selected band and selected mask combination you will get a set of statistics results. By default the band selected within the File Manager is selected in this statistics band selecter. However, you can select and deselect whichever band(s) you wish.
Note: although this tool is a multi-band tool, it does have a single "current" band behavior in that whenever you select a band within the File Manager, the Statistics tool will reset its selected bands to that band. When it does this, all parameters which are band sensitive (based on a geophysical unit value) will be reset to the defaults.
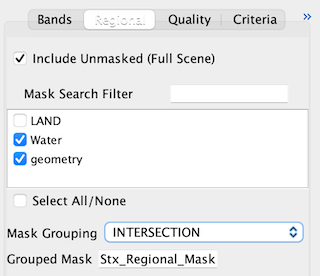
This is accessible from within the Statistics window. You can select multiple masks from within the same file on which to simultaneously generate the same statistics fields. For each selected band and selected mask combination you will get a set of statistics results. No masks are selected by default. You have the option to logically group the masks together, in which case a new mask is created.
Note: once you have made selections within this mask selector, the selections are not altered if you change to a different band (within the same file) in the File Manager. This behavior has been chosed as mask selection is less apt to be so band dependent. However, if you change to a different file within the File Manager, then this mask selector will indeed reset as the masks within a different file can vary.
Include Unmasked (Full Scene)
Selecting this gives you an entry of statistics results for the full scene with no masking applied.
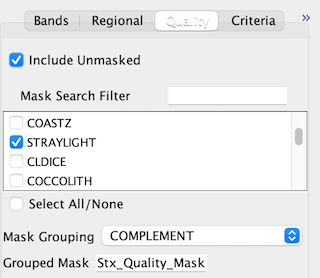
This is accessible from within the Statistics window. You can select multiple masks from within the same file on which to simultaneously generate the same statistics fields. For each selected band and selected mask combination you will get a set of statistics results. No masks are selected by default. You have the option to logically group the masks together, in which case a new mask is created.
Note: once you have made selections within this mask selector, the selections are not altered if you change to a different band (within the same file) in the File Manager. This behavior has been chosed as mask selection is less apt to be so band dependent. However, if you change to a different file within the File Manager, then this mask selector will indeed reset as the masks within a different file can vary.
Include Unmasked
Selecting this gives you a set of statistics with no quality masking applied.
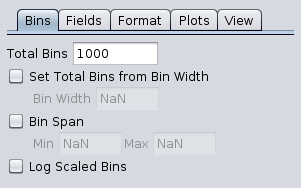
This is a tab of the Statistics window. Its parameters are used to define the binning range and resolution used by histogram based statistics which includes the percent threshold fields.
Total Bins
The number of bins.
Set Total Bins from Bin Width
The number of bins (auto-calculated based on a specified bin width). Such a parameter is very product specific so it is not set for use by default nor does it appear in the preferences.
Bin Span
The range of the bins. Such a parameter is very product specific so it is not set for use by default nor does it appear in the preferences.
Log Scaled Bins
Use log scaling for the bins.
Note: The histogram plots only display the labels as the log of the number.
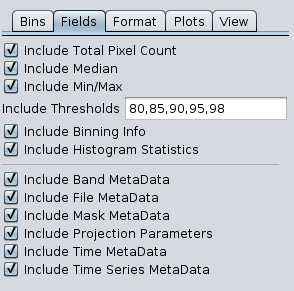
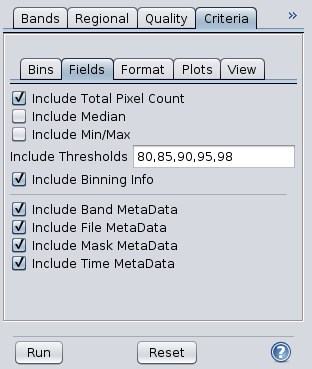
This is a tab within the Statistics GUI window. This contains parameters to let you specify the fields which you want displayed in the results. In the GUI, there is a separator to distinguish between the statistics fields (above) and the metadata fields (below). The fields listed below the separator only get written to the spreadsheet. Many of these fields are actually a grouping of fields. (For more specifics on each field see Fields)
Note: the figure shown and description includes some additional fields (disabled by default) which can be enabled within the Preferences page for the Statistics tool (For more on this see Preferences).
Include Total Pixel Count
Includes a group of fields indicating the pixel counts. These fields include: Pixels, Valid_Pixels, Fraction_Valid.
Note: deselecting this field still displays "Valid_Pixel". The other fields can take longer to create, which is why this selector is made available.i>
Include Median
This median value of the "valid" pixels. Calculated by converting 2d raster of "valid" pixels into an array and then obtaining the center element of the array. This can be slow for large file, which is why this field can be optionally disabled here.
Include Binning Info
Includes a group of fields indicating the binning parameters used in calculating the histogram-based statistics. These fields include: Total_Bins, Bin_Min, Bin_Max, Bin_Width.
Include Thresholds
This is a comma delimited list of percent thresholds to calculate using the histogram-based statistics. If nothing is in this textfield then no percent thresholds will be calculated.
Include Histogram Statistics
Includes some statistics fields calculated from the histogram. These include: Mean(Binned), Median(Binned), StandardDeviation(Binned).
Note: by default, this parameter is not available. You can access this parameter by modifying your statistics Preferences. (For more on this see Preferences)
Include Band MetaData
Adds band metadata fields to the spreadsheet. These fields include: Band, Unit, Band_Valid_Expression, Band_Description.
Include File MetaData
Adds file metadata fields to the spreadsheet. These fields include: File, File_Format, File_Type, File_Width, File_Height, Sensor, Platform, Resolution, Day_Night, Orbit, Processing_Version, Projection.
Include Mask MetaData
Adds mask metadata fields to the spreadsheet. These fields include: Mask, Mask_Description, Mask_Expression.
Include Time MetaData
Adds time metadata fields to the spreadsheet. These fields include: Start_Date, Start_Time, End_Date, End_Time.
Include Time Series MetaData
Intended for files created by the SeaDAS time series tool. Adds time series metadata fields to the spreadsheet. These fields include: Time_Series_Date, Time_Series_Time.
Note: by default, this parameter is not available. You can access this parameter by modifying your statistics Preferences. (For more on this see Preferences)
Include Projection Parameters
If available display full WKT of the coordinate reference system. This can be a large text string and the field is Projection_Parameters.
Note: by default, this parameter is not available. You can access this parameter by modifying your statistics Preferences. (For more on this see Preferences)
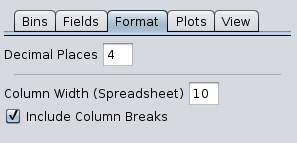
This is a tab accessible from within the Statistics window. These parameters enable you to format the text rendition of the statistics results (sush as decimal places) as well as to adjust some formatting to the spreadsheet. The line separator within this tab delineates the aspects which are only applicable to the spreadsheet. Parameters listed below the separator are only applicable to the spreadsheet.
Decimal Places
For numbers which are not integers, this sets the number of decimal places.
Column Width
Sets the displayed width of the columns within the statistics GUI spreadsheet.
Note: Setting the column width to a value of less than 10 will result in this field being ignored such that the columns will auto-adjust to show the full text entry for all entries.
Note: If an entry cannot fit within the column width, it will be partially display. Even though the full entry is not displayed, it is there in full and the spreadsheet can be saved to the clipboard and copied into another program.
Include Column Group Breaks
This creates separator columns with the entry "||" between each grouping of metadata in the statistics GUI spreadsheet.
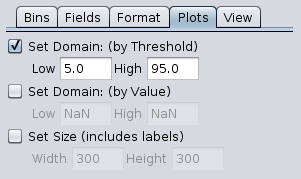
This is a tab accessible from within the Statistics window. These parameters enable you to format the histogram and percentile plots which are generated. The same formatting will be applied to all plots generated. Subsequently you may format any individual plot in the GUI by right-clicking on it and selecting "Properties".
Set Domain: (by Threshold)
This creates plots where the domain (x-axis) spans the specified thresholds.
Hint: this feature can be quite useful, especially when a large portion of your data only occupies a narrow span of the full valid range of the data. By not plotting the high and low outliers you can better "see" the data, and better determine whether your specified bin resolution is high enough. If you try this out on chlor_a in a full scene level-2 file, you will likely observe that a bin count of 1000 bins crams most data into just couple bins, whereas a higher bin count such as 10,000 or 100,000 bins will spreads the data out across many bins resulting in a better looking plot and more meaningful percent threshold results.
Note: since the percent thresholds are determined from histogram-based binning, the plot range is affected by your bining criteria specification in the "Bins" parameter window.
Set Domain: (by Value)
This creates plots where the domain (x-axis) span the specified value.
Note: this is value specific and not all bands have the same units and value range. This tool allows for the simultaneous generation of statistics for multiple bands and setting the domain by value may cause some bands for have plots whose domain does not capture the data. Because of issue, this field is not available in the Preferences
Set Size
This sets the size (in pixels) on the plots generated within the statistics window. If deselected then the plots are auto-sized in an attempt by SeaDAS to "best fit" the plots into the GUI window. If you select this parameter then the plots will be generated with the exact pixel sizing specified in the "Width" and "Height" fields.
Note: this size includes the pixels used for the axis labels and axis titles. Consequently setting the same value for both Width and Height will likely not produce a square plot.
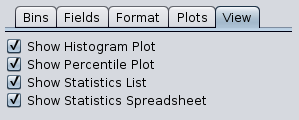
This is a tab accessible from within the Statistics window.
Show Histogram Plot
Generates the histogram plot, which is a bin-based plot.
Show Percentile Plot
Generates the percentile plot, which is a bin-based plot.
Show Statistics List
Generates the statistics in list form. This listing includes only the numerical statistics and does not include the metadata.
Show Statistics Spreadsheet
Generates the statistics in spreadsheet form, which includes both statistics and metadata. You
can easily copy the contents of this spreadsheet to your clipboard by clicking on the center of the mouse while
hovering over the spreadsheet. Then you can copy your clipboard into a spreadsheet program such as Excel.
Preferences
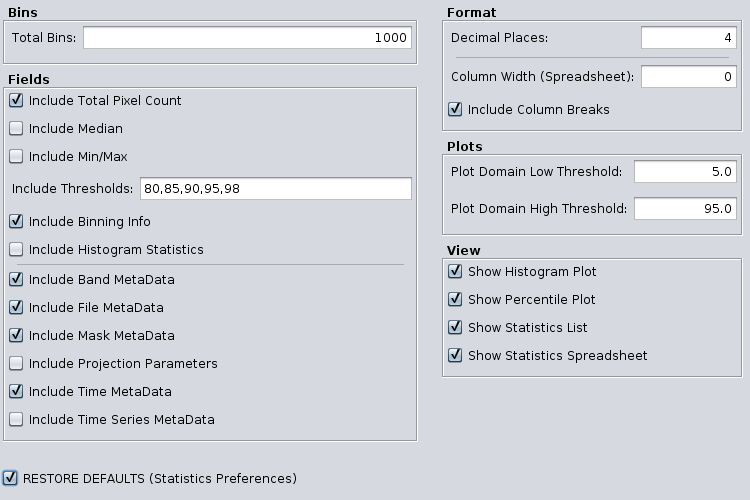
The Statistics tool contains an extensive preferences page for parameters which are not based on geophysical value. You can change any of the defaults within this page to better suit your specific short-term or long-term needs. Any modifications which you make to the preferences will be retained in future SeaDAS sessions. This page is divided up to corresponds with the parameter tabs of the GUI: Bins, Fields, Format, Plots, and View.
If at anytime you wish to restore the default preferences select "RESTORE DEFAULTS (Statistics Preferences)" in this window.
Note: if you alter the preferences they will automatically show up in future SeaDAS sessions. They will not automatically show up in the current session (unless you have not open the Statistics tool in the current session, in which case they will show up). This force them to load into the current session Statistics tool by going to the Statistics tool and clicking the "RESET" button.
Menu Location
The Statistics tool can be accessed in the menu system (Analysis -> Statistics) or by clicking the tool bar icon ![]()
This tool is also available from the command line.
Command Line Tool (GPT)
The Statistics tool can also be run from the command line using SeaDAS GPT (graph processing tool).
Revision History