
| Time Series Graph | |
The main analysis tool for the time dimension the Time Series Tool comprises is the Time Series Graph, shown in
Screenshot 1. It is opened by clicking on  .
.
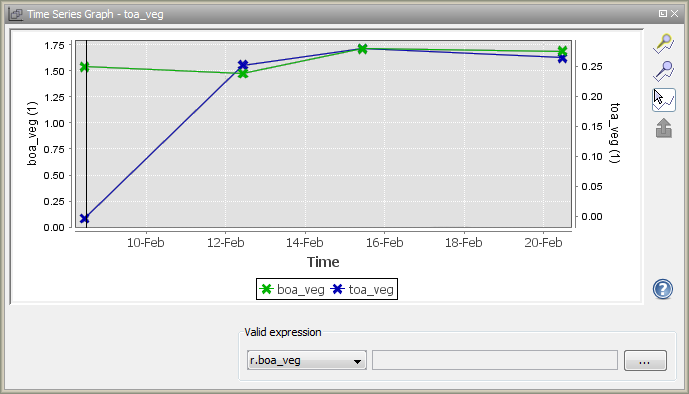
This tool may be used to compare values of different measures, such as toa_veg or boa_veg
(given by the variables), for the specified time teries. It shows an arbitrary number of variables for the whole
time series at once. The x-axis determines the point in time while the several y-axes represent the unit of the
respective variable. In the example provided in Screenshot 1, the variables toa_veg and
boa_veg are compared; each features its own y-axis. The values shown in the graph are the values at
a given pixel position for all points in time which are part of the time series -- in the example, the values
of the pixel position of the cursor are shown. This feature can also be turned off using the
 -switch.
Another feature of the graph is to show the values of selected pins or of all pins. This feature can be controlled
by the  and the
 -switches. For each pin in the product which is
displayed in the graph, a dashed line for each variable is drawn. In order to facilitate discrimination between
pin positions, each dashed line for each position is assigned a specific symbol. The colors reflect the variables:
different variables result in different colors.
-switches. For each pin in the product which is
displayed in the graph, a dashed line for each variable is drawn. In order to facilitate discrimination between
pin positions, each dashed line for each position is assigned a specific symbol. The colors reflect the variables:
different variables result in different colors.
This behaviour is reflected in the graph's legend.
Additionally, the Time Series Graph is the tool which allows dealing with in-situ data. When in-situ data has been loaded into the time series, pins are created for the respective position, and both in-situ values and the pixel values from the satellite data are displayed in the graph. Furthermore, the rules of pin handling apply, apart from that in-situ positions are reflected by unfilled shapes, while pin positions are assigned filled shapes.
In order to exclude bad data, the Time Series Graph allows the user to specify valid expressions. Data which does not satisfy these expressions is excluded from display. It is possible to specify valid expressions for both satellite and in-situ data. Valid expressions may be assigned to each variable using the bottom panel of the graph window.
For automated analysis or further investigation, the graph it allows exporting pin values to a text file by clicking
 (CSV-format, tab-separated). See Listing 1 for exemplary
output.
(CSV-format, tab-separated). See Listing 1 for exemplary
output.
| #Time Series pin time series export table | ||||||||||
| # | ||||||||||
| #Product: TimeSeries_toa_veg | ||||||||||
| #Created on: Fri Feb 03 11:56:55 CET 2012 | ||||||||||
| ||||||||||
| Name | X | Y | Lon | Lat | Variable | Unit | 08-02-2005 | 12-02-2005 | 15-02-2005 | 20-02-2005 |
| Pin 1 | 461 | 467 | 7.8333 | 54.6667 | toa_veg | NaN | 0.46 | 0.3285 | 0.1894 | |
| Pin 1 | 461 | 467 | 7.8333 | 54.6667 | boa_veg | 2.1855 | 1.953 | 2.0634 | 1.8534 | |
| Pin 2 | 52 | 345 | 21.12 | 64.43 | toa_veg | 0.8342 | 0.236 | 0.825 | 0.3294 | |
| Pin 2 | 52 | 345 | 21.12 | 64.43 | boa_veg | 2.423 | 1.5234 | 1.243 | 2.056 | |
|
||||||||||
| Listing 1 - Exemplary time series pin pixel export | ||||||||||
Copyright © 2012 by Brockmann Consult (beam-issues@brockmann-consult.de). All rights reserved.