
| Expectation Maximization (EM) Cluster Analysis |
|
Cluster analysis (or clustering) is the classification of objects into different groups, or more precisely, the partitioning of a data set into subsets (clusters or classes), so that the data in each subset (ideally) share some common trait - often proximity according to some defined distance measure. Data clustering is a common technique for statistical data analysis, which is used in many fields, including machine learning, data mining, pattern recognition, image analysis and bioinformatics. The computational task of classifying the data set into k clusters is often referred to as k-clustering.
The EM algorithm implemented in SNAP can be regarded as a generalization of the k-means algorithm. The main differences are:
The algorithm is described in detail on the Wikipedia entry on Expectation maximization. Use this algorithm when you want to perform a cluster analysis of a small scene or region-of-interest and are not satisfied with the results obtained from the k-means algorithm.
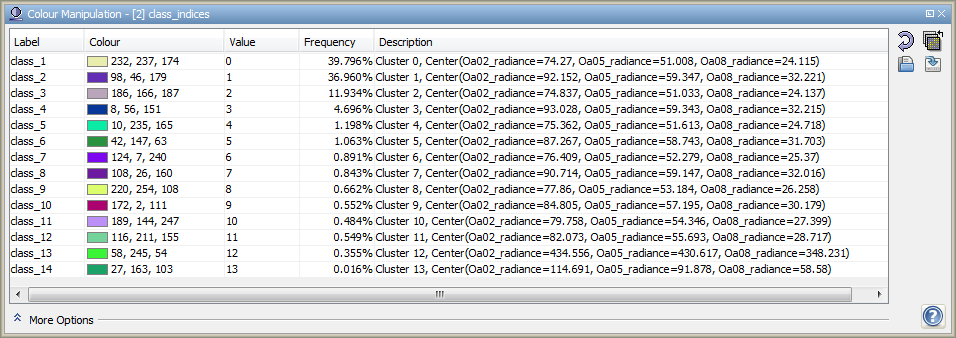
The result of the cluster analysis is written to a band named class_indices. The values in this band indicate the class indices, where a value '0' refers to the first cluster, a value of '1' refers to the second cluster, etc. The class indices are sorted according to the prior probability associated with cluster, i.e. a class index of '0' refers to the cluster with the highest probability.
Note that an index coding is attached to the class_indices band, which can be edited in the Color Manipulation Window. It is possible to change the label and the color associated with a class index. The last columns of the color manipulation window lists the location of the cluster centers. Further information on the clusters is listed in the Cluster-Analysis group of the product metadata.
The EM cluster analysis tool can be invoked in the Sentinel Toolbox from the tool menu by selecting
Processing->Image Analysis->EM Cluster Analysis....
In the command line it is available by means of the Graph Processing Tool gpt which is located in
the Sentinel Toolbox bin
directory. Please type gpt EMClusterAnalysis -h for further information.
Selecting the EM Cluster Analysis command from the Sentinel Toolbox tool menu pops up the following dialog:
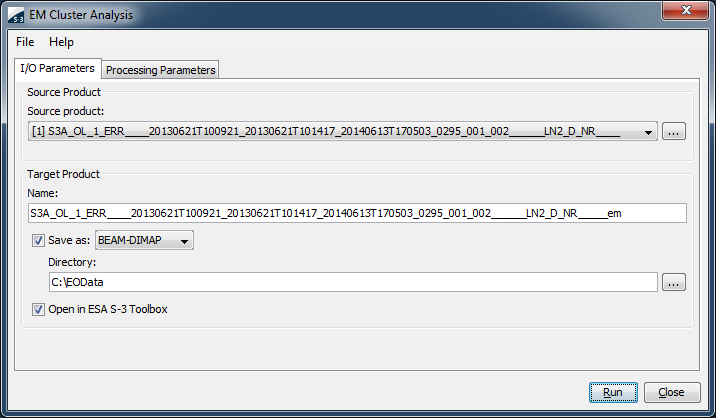
Name: Here the user specifies the name of the source product. The combo box presents a list of all products opened in the Sentinel Toolbox. The user may select one of these or, by clicking on the button next to the combo box, choose a product from the file system.
Name: Used to specify the name of the target product.
Save as: Used to specify whether the target product should be saved to the file system. The combo box presents a list of file formats, currently BEAM-DIMAP, GeoTIFF, and HDF5. The text field allows to specify a target directory.
Open in SNAP: Used to specify whether the target product should be opened in the Sentinel Toolbox. When the target product is not saved, it is opened in the Sentinel Toolbox automatically.
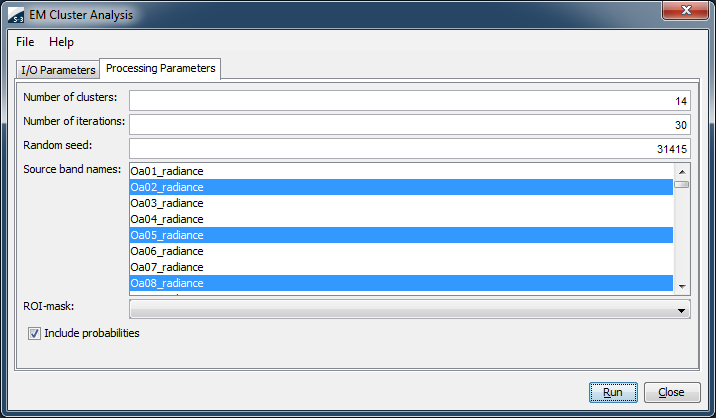
Number of clusters: Use this field to specify the number of clusters. The default is 14 clusters.
Number of iterations: Use this field to specify the maximum number of iterations to be carried out. The default is 30 iterations. The cluster analysis stops when the maximum number of iterations is exceeded.
Random seed: The EM algorithm starts with a pseudo-random distribution of initial clusters. The random seed initializes the pseudo-random number generator, which is used to generate the initial clusters. By changing the random seed, you can start with different initial clusters. Any positive integral number will be a perfect random seed. The default seed is 31415.
Source band names: Use this field to specify the names of the source bands. Press the control key while selecting or deselecting individual bands.
ROI-Mask: Use this field to restrict the cluster analysis to a region-of-interest (ROI). The combo box allows to select the band which provides the ROI.
Include probability bands: Check this box if you want the cluster posterior probabilities to be included in the target product. The target then will contain a single probability band for each cluster.
Run Creates the target product. The cluster analysis is actually deferred until its band data are accessed, either by writing the product to a file or by viewing its band data. When the Save as option is checked, the cluster analysis is triggered automatically.
Close Closes the dialog.
Help Displays this page in the Sentinel Toolbox Help.
A good starting point for obtaining further information on cluster analysis terms and algorithms is the Wikipedia entry on data clustering.